CFD-Based Performance Evaluation of HVAC System
Modern HVAC systems demand precise airflow control to ensure energy efficiency, indoor air quality, and thermal comfort. This technical blog presents a detailed Computational Fluid Dynamics (CFD) analysis of HVAC airflow focusing on duct behavior, diffuser performance and turbulence.
Explore Our Key Services: HVAC Air Balancing Services | Contact Us
Why CFD-Based HVAC Airflow Analysis Matters
Traditional HVAC air balancing techniques often fail to capture localized turbulence, uneven diffuser flow, and dynamic pressure variations inside duct systems. These blind spots can lead to wasted energy, poor indoor air quality (IAQ), and inconsistent thermal comfort.
By applying Computational Fluid Dynamics (CFD) simulation to HVAC systems, engineers gain a powerful tool to:
- Visualize airflow patterns across ducts, bends, and diffusers
- Identify inefficiencies such as recirculation zones and high-pressure drops
- Optimize duct and diffuser designs before field deployment
- Validate performance with real-world sensor data for accuracy
CFD-based analysis bridges the gap between theoretical design and practical operation, ensuring HVAC systems deliver energy efficiency, comfort, and reliability from the start.
CFD vs Traditional Air Balancing
Traditional methods measure airflow but cannot detect turbulence, uneven distribution, or flow imbalances within ducts. CFD, on the other hand, allows for a comprehensive visual and mathematical analysis, allowing engineers to resolve flow issues before the system is even installed.
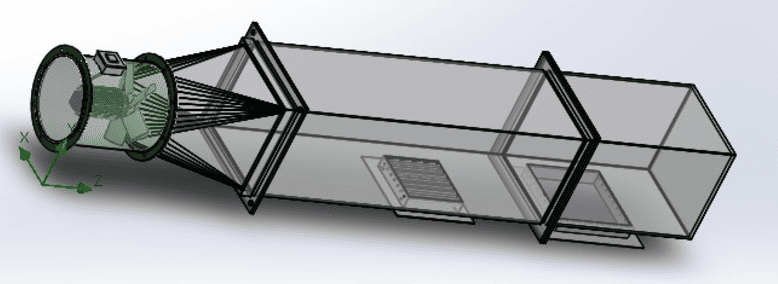
Figure 1 – 3D CAD assembly used for CFD airflow simulation
Figure 2 – CFD simulation video
System Configuration and Simulation Methodology
The simulated HVAC setup includes a 12-inch axial fan, a 6-ft duct designed using the Equal Friction Method, and two air diffusers (12×12 inch and 9×9 inch). The CFD model assumes incompressible airflow, atmospheric outlet pressure, and gravity effects to replicate real-world HVAC operating conditions.
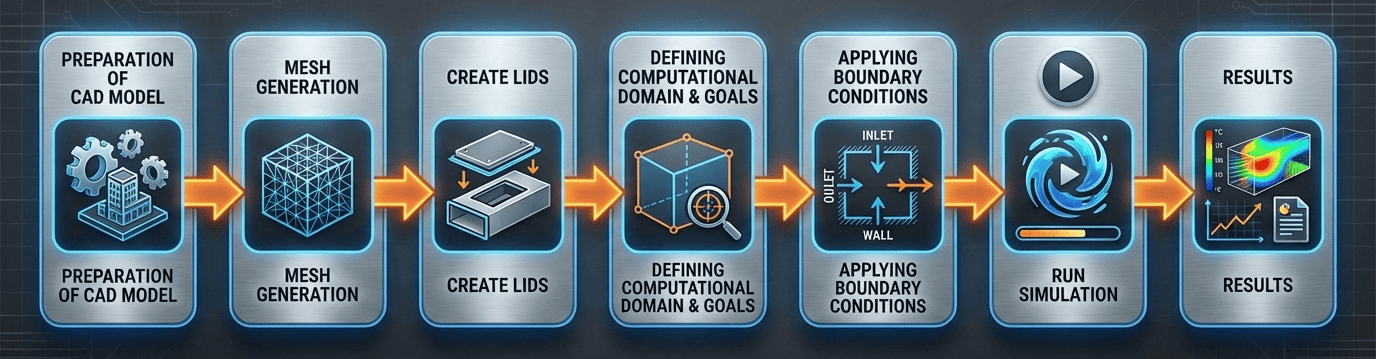
Figure 3 – CFD methodology for HVAC airflow analysis
Inlet Flow Characteristics
CFD results at the duct inlet show highly uniform airflow with a constant velocity of 17.093 m/s and minimal pressure variation. This confirms stable fan performance and provides a reliable baseline for analyzing diffuser-level airflow disturbances.
Velocity Measurement at Nine Points
To better understand airflow distribution, velocity was measured at nine distinct points within the SolidWorks model. This visualization highlights how airflow interacts with the grille geometry, revealing localized variations in speed and turbulence that are critical for accurate HVAC performance evaluation.
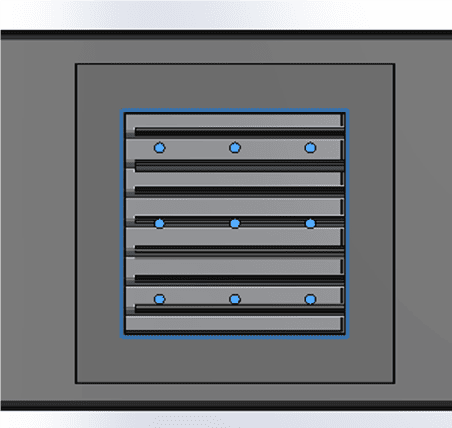
Figure 4 – Point for Airflow
CFD Case Study: 9x9 vs 12x12 Diffuser Airflow Performance
The following figures show the CFD simulation results for the 9×9 and 12×12 inch diffusers. Displaying them side by side highlights the differences in airflow distribution and average velocity.
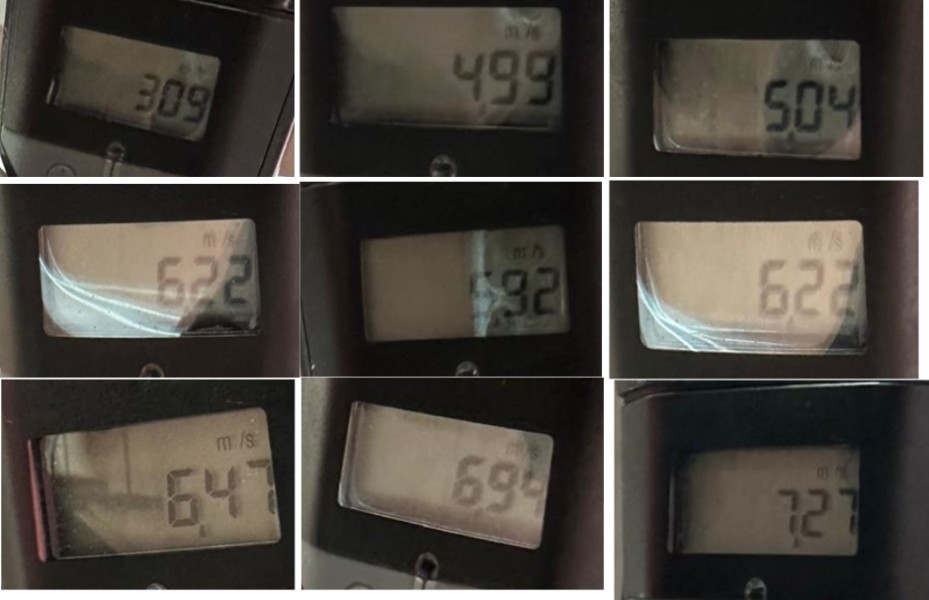
Figure – 9×9 Diffuser (Average Velocity ≈ 10.62 m/s)
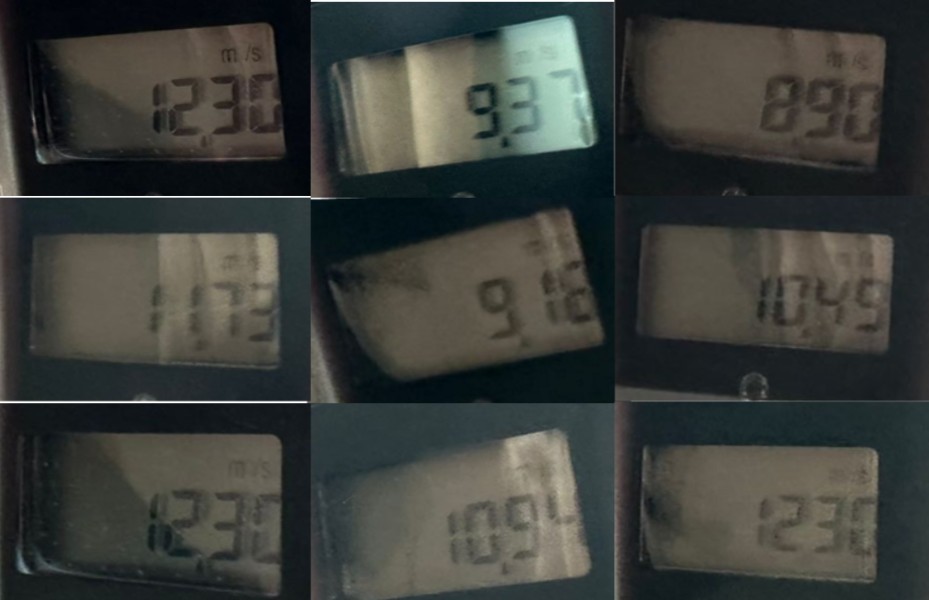
Figure – 12×12 Diffuser (Average Velocity ≈ 12.69 m/s)
CFD & Real-Life Velocity Measurements Results – 12×12 Inch Diffuser
The SolidWorks simulation for the 12×12 diffuser provides velocity and pressure values at nine distinct points. The results highlight uneven airflow distribution across the diffuser surface, with noticeable variations in velocity at different coordinates. The calculated average velocity is approximately 12.69 m/s, which indicates stronger airflow compared to the 9×9 diffuser but also reveals localized imbalances. These variations confirm that even larger diffusers can experience turbulence and uneven distribution, impacting efficiency and comfort in real-world HVAC applications.
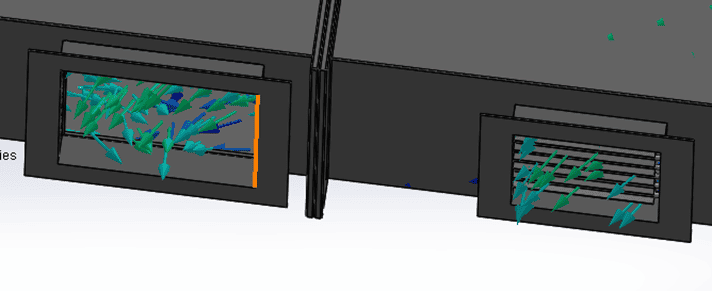
Figure 5 – Velocity distribution and turbulence at 12×12 inch diffuser
| X [m] | Y [m] | Z [m] | Actual Velocity (m/s) | CFD Velocity (m/s) |
|---|---|---|---|---|
| 0.13310863 | -0.0272815 | 2.39464807 | 12.30 | 15.08 |
| 0.13310863 | -0.0272815 | 2.29017448 | 9.37 | 12.44 |
| 0.13310863 | -0.0272815 | 2.49912166 | 8.90 | 8.96 |
| 0.23758214 | -0.0270930 | 2.44688487 | 11.73 | 15.30 |
| 0.23758214 | -0.0270930 | 2.34241120 | 9.18 | 15.98 |
| 0.23758214 | -0.0270930 | 2.23793768 | 10.49 | 14.03 |
| 0.34205567 | -0.0269045 | 2.39464807 | 12.30 | 16.96 |
| 0.34205567 | -0.0269045 | 2.29017448 | 10.94 | 8.93 |
| 0.34205567 | -0.0269045 | 2.49912166 | 12.30 | 16.54 |
Table 1 – SolidWorks CFD & Real-life simulation results for 12×12 inch diffuser showing uneven airflow distribution across measured points
CFD & Real-Life Velocity Measurements Results – 9×9 Inch Diffuser
The SolidWorks simulation for the 9×9 diffuser provides velocity and pressure values at nine distinct points. The results highlight uneven airflow distribution across the diffuser surface, with noticeable variations in velocity at different coordinates. The calculated average velocity is approximately 10.62 m/s, which confirms that while the diffuser delivers strong airflow overall, localized differences create asymmetry and turbulence. Such uneven distribution can reduce efficiency and comfort in real-world HVAC applications.
Figure 5 – Velocity distribution and turbulence at 12×12 inch diffuser
| X [m] | Y [m] | Z [m] | Real Real-Life Velocity (m/s) | CFD Velocity (m/s) |
|---|---|---|---|---|
| 0.24647212 | -0.02707702 | 1.654016852 | 3.09 | 3.21 |
| 0.324827254 | -0.02695365 | 1.654016852 | 4.99 | 3.95 |
| 0.168116987 | -0.02721839 | 1.654016733 | 5.04 | 5.86 |
| 0.246472105 | -0.02707702 | 1.732372165 | 6.22 | 13.63 |
| 0.324827254 | -0.02695365 | 1.732372165 | 5.92 | 12.35 |
| 0.168116987 | -0.02721839 | 1.732372165 | 6.22 | 14.52 |
| 0.24647212 | -0.02707702 | 1.810727477 | 6.47 | 13.66 |
| 0.324827254 | -0.02695365 | 1.810727477 | 6.94 | 13.65 |
| 0.168116987 | -0.02721839 | 1.810727477 | 7.27 | 14.81 |
Table 2 – SolidWorks CFD & Real-life simulation results for 9×9 inch diffuser showing uneven airflow distribution across measured points
Interpretation of Real-Life & CFD Simulation Diffuser Results
A comparison between experimentally measured air velocities and CFD simulation results reveals a consistent deviation for both diffuser sizes, with real-life velocities being significantly lower than the CFD-predicted values. For the 12 × 12 inch diffuser, the average real-life (measured) air velocity is 10.83 m/s, whereas the CFD simulation predicts a higher velocity of 13.80 m/s. Similarly, for the 9 × 9 inch diffuser, the measured average velocity is 5.80 m/s, while the CFD result indicates a substantially higher value of 10.63 m/s. This trend clearly indicates that CFD simulations tend to over-predict airflow velocity when compared with actual operating conditions.
The observed discrepancy can be attributed to several real-world factors that are difficult to capture fully in numerical simulations. These include:
Overall, the results highlight the importance of validating CFD simulations with experimental or field measurements. While CFD provides valuable insight into airflow trends and relative performance, real-life measurements are essential for accurate system calibration and final air balancing. Incorporating correction factors or calibration based on measured data can significantly improve the reliability of CFD-based predictions for practical HVAC applications.
Key Engineering Insights
- CFD analysis identifies diffuser-level airflow imbalance invisible to manual methods.
- Vorticity correlates directly with energy loss and reduced HVAC efficiency.
- CFD-based analysis enables detection and correction of airflow irregularities.
- CFD-supported calibration significantly improves field measurement accuracy.
Frequently Asked Questions
What is CFD in HVAC?
CFD (Computational Fluid Dynamics) is used to simulate airflow, hit mapping, pressure distribution, and turbulence within HVAC systems to optimize performance and prevent efficiency loss.
Why is CFD important in air balancing?
It helps detect airflow inefficiencies, verifies that duct and diffuser designs work before implementation, and provides engineers with accurate data to ensure an evenly balanced system.
Conclusion: The Future of Smart HVAC Air Balancing
This study confirms that integrating CFD-based HVAC airflow analysis with Real Life System enables predictive, data-driven air balancing. As HVAC systems evolve toward smart infrastructure, airflow intelligence will be as critical as temperature control. Engineers and commissioning teams can leverage CFD insights to design more efficient ductwork, optimize diffuser placement, and achieve sustainable indoor comfort.